What is the receivables forecast?
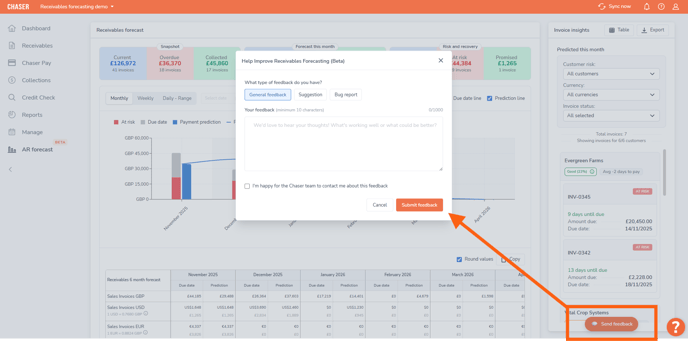
Receivables forecast beta
The receivables forecast is currently in its beta testing period. Your thoughts, feedback or any insights into problems you may have experienced while using the tool are extremely valuable. Please provide feedback using the Send feedback option inside of the AR forecast tool.
Future availability
Using the receivables forecast dashboard
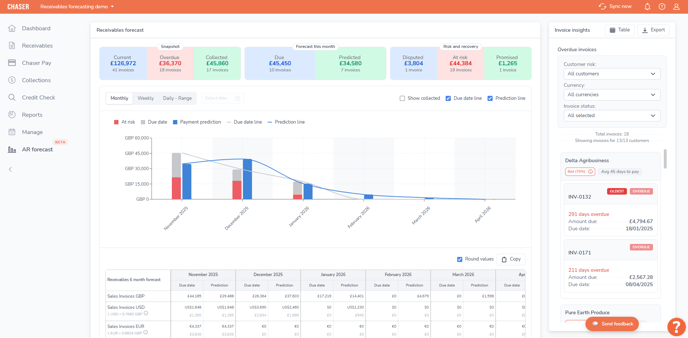
The dashboard is broken down into several key sections to help you find the information you need quickly.
Top level summaries
The widgets at the top of the page provide a high-level snapshot of your current receivables:
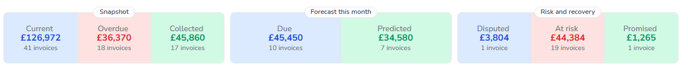
Snapshot
A summary of all key receivables metrics.
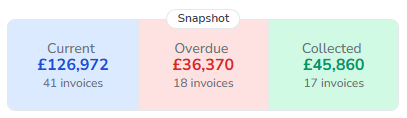
- Current: The total value of all your outstanding invoices.
- Overdue: The total value of all invoices that are past their due date.
- Collected: The total value of invoices that have been successfully paid within the current month.
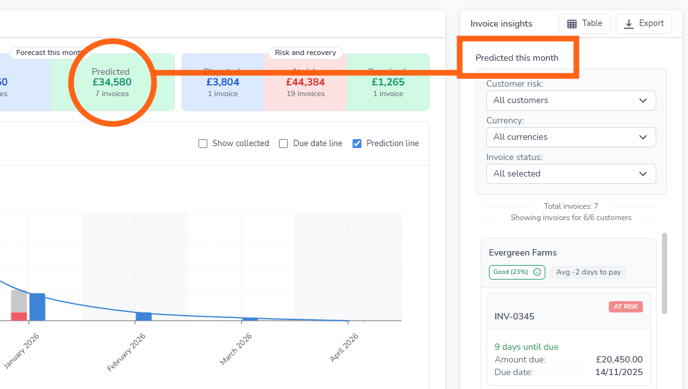
Forecast this month
This section breaks down the payments expected in the current month, helping you distinguish between what is contractually due and what you can realistically expect to receive:

- Due: The total value of all invoices that have a due date falling within this month. This figure is based purely on the invoice due date.
- Predicted: The total value of invoices the system predicts you will receive this month. This forecast is based on your customers' past payment behaviors.
Risk and recovery
This section helps you identify and prioritize potential payment issues:

- Disputed: The total value of all invoices currently marked as "Disputed".
- At risk: The total value of invoices that the system has identified as being at risk of late payment or non-payment.
- Promised: The total value for invoices where a customer has promised a payment and an "Expected payment date" has been logged in Chaser.
The receivables forecast chart and table
This is the main, interactive part of your forecast, giving you a visual and numerical breakdown of your cash flow over time.
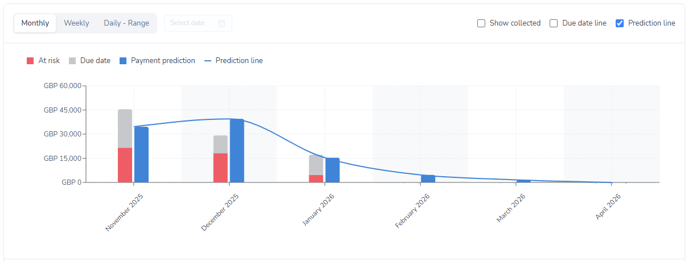
Receivables forecast chart
The main chart provides a visual timeline of your expected payments. You can customize this view to see the data that matters most to you:
- Filter by time: Use the Monthly, Weekly, and Daily - Range toggles to adjust the chart's time frame.
- Filter by data: Use the checkboxes (e.g., "At risk," "Due date," "Payment prediction") to show or hide different data points on the chart.
The receivables forecast table
Below the forecast chart, you'll find a detailed table that breaks down your receivables data numerically for the next six months.
Any time filter you select for the chart (Monthly, Weekly, or Daily - Range) will also automatically apply to this table, so your data always stays in sync.
Understanding the table layout:
- Currency separation: The table automatically groups your sales invoices by their original currency (e.g., GBP, USD, EUR, ZAR).
- Due date vs. Prediction: For each time period, you can easily compare the total value of invoices based on their due date against the total value based on the prediction.
- Total at risk: This row shows the total value of "at risk" invoices for the period, converted into your organization's base currency.
- Monthly totals: The final row summarizes the total "Due date" and "Prediction" values for each period, all shown in your base currency.
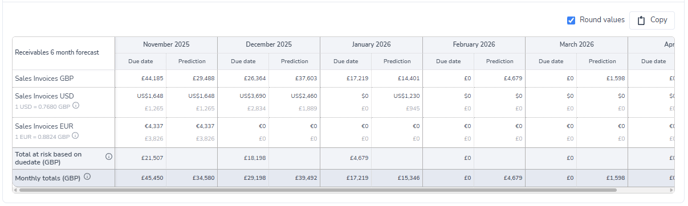
Table controls:
- Round values: Uncheck this box to see exact values, including cents.
- Copy: Use this helpful button to copy all the data from the table. You can then paste it directly into a spreadsheet in Excel or Google Sheets, with no export needed. This copies the exact values you see on screen.
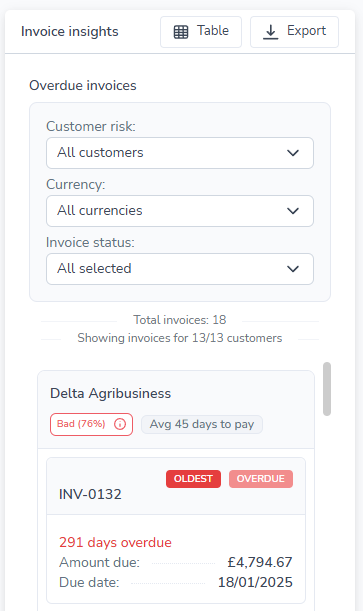
Drill down with invoice insights
The invoice insights panel is a powerful, interactive part of your dashboard. It lets you click on almost any data point to instantly see the specific invoices that make up that value.
How it works
When you click on a value, the invoice insights panel will slide open on the right, pre-filtered to show the relevant list of invoices.
You can click on:
- The summary snapshots (e.g., "Current," "Overdue")
- The "Forecast this month" and "Risk and recovery" widgets
- Individual bars on the forecast chart (e.g., "Due date," "Prediction")
- Any individual cell in the receivables forecast table
Filter your view
Once the list is open, you can filter it further using the dropdowns for Customer risk, Currency, and Invoice status.
To help you understand the data more quickly, the filters are "smart." This means the dropdowns will only show options that are relevant to the list of invoices currently being viewed.
Export your list
To download the currently filtered list of invoices, just click Export. This will generate a CSV file for you to use.
Viewing insights as a table
If you prefer to see your invoice data in a detailed list format, you can easily switch to the table view.
In the invoice insights header, just click the Table button.
This opens a pop-up window that displays all the invoices from your filtered selection in a clear table. From this window, you can:
- Export: Download the entire list of invoices as a CSV file.
- Copy: Copy the invoice data currently visible on the page to paste directly into a spreadsheet.
Important: The Copy button is a quick way to grab small amounts of data. It will only copy the invoices shown on the current page (e.g., the first 50 invoices).
For larger lists that span multiple pages, always use the Export button to ensure you get the complete set of data.

Understanding your forecast metrics
The forecast uses several key metrics to help you understand your customers' payment behavior.
Average days to pay
This metric shows the average number of days it takes for a customer to pay an invoice after its due date.
- How it's calculated: This figure is based on your customer's paid invoice history. To ensure this number is accurate, please make sure you mark invoices as paid in your accounting system.
- Negative numbers: You may see a negative value (e.g., -5 days). This means the customer, on average, pays their invoices before the due date.
- Payment predictions: This metric is a key part of your forecast. The payment prediction feature uses this value to project when you can realistically expect payment for that customer's outstanding invoices.
Payer rating
Chaser's payer ratings (Good, Average, Bad) are generated by an advanced machine learning model to help you quickly identify potential payment risks.
- Not applicable: If you see "Not applicable," it simply means the customer does not have enough payment history yet to generate a rating.
- Understanding differences: You might occasionally see a customer with a "Good" rating but a high "average days to pay." This can happen because the "average days to pay" is a simple historical average, while the "payer rating" is a more complex prediction that analyzes other patterns.
- What to do: If you see a rating that seems unusual, the average days to pay is a very accurate and trustworthy reference for that customer's typical payment behavior.
How "expected payment dates" affect your forecast
It's important to know how logging an expected payment date on an invoice (what we also call a "promised payment") impacts your forecast figures.
When you enter an expected payment date for an invoice, Chaser uses that date as the new, most accurate piece of information. This new date will override both the original due date and the system's prediction.
- For "Due" calculations: The forecast will treat this new expected payment date as the invoice's new due date.
- For "Predicted" calculations: The forecast will also use this date as the new predicted payment date.
Performance and data refreshing
Initial load time
When you first load the receivables forecast, you may notice a short delay, especially if you have a large amount of data. This is normal, as the system is performing complex calculations.
On future visits, the tool will load much faster as this data is cached to improve performance.
Seeing your latest data
Because the system caches data to improve speed, you may sometimes experience a short delay between updating an invoice (like marking it as "Promised" or "Disputed") and seeing that change reflected in your receivables forecast.
If you need to see an immediate update, you can usually force a refresh by:
- Syncing your data in Chaser.
- Refreshing your browser.
For the best results, please make sure Chaser is not open in any other browser tabs before you refresh. This helps clear the old cache.
If your data still seems out of date after a long period (for example, it is still not updated the next day), please contact the Chaser support team. We will be happy to investigate this for you.
Related articles