![Chaser-logo-new-white.svg]](https://help.chaserhq.com/hubfs/09%20CHASCEND%20THEME/Logos/Chaser%20Logo/Chaser-logo-new-white.svg)
Find your debtor relationship management (DRM) dashboard under Home in the main menu.
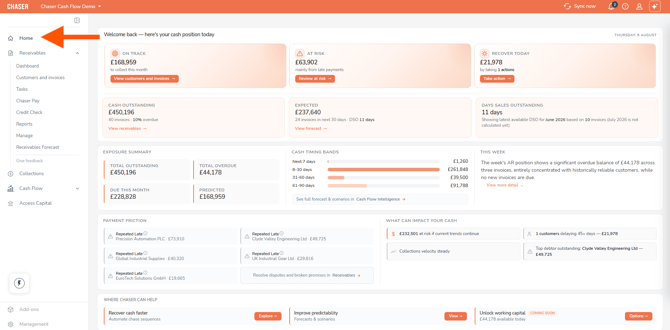
See your receivables position, payment risks, and priority actions in one place. The DRM dashboard is built for finance leaders, credit controllers, and accounts receivable (AR) managers who need to know what's at risk and what to do next, without digging through reports.
What you can do
- See your total exposure, overdue amounts, and the cash you're on track to collect this month.
- Identify invoices and debtors at risk of late payment before they become a problem.
- Spot payment friction flags, such as repeated late payers, broken promises, and disputes.
- Take action straight from the dashboard, including chasing, credit checks, and collections.
Before you start
- Connect your accounting system to Chaser. Chaser integrates directly with Xero, QuickBooks, Sage Business Cloud Accounting, Business Central, Sage 50, Sage 200, Sage Intacct, NetSuite, AccountsIQ, and Odoo. If you use something else, upload a CSV file or build a custom integration with the Chaser OpenAPI.
- Some features depend on your plan and accounting integration. Cash Flow Intelligence is only available for Xero and AccountsIQ.
- Receivables features need an active trial or paid plan.
- Dispute and broken promise flags need data from Receivables, or from Xero if you set expected payment dates there.
How to read your dashboard
Today's priorities
Start with the three tiles at the top of your dashboard. Each one has a button that takes you straight to the debtors, invoices, or actions behind the figure.
- On track: cash due this month or next that you're likely to collect within the current month, based on how your debtors usually pay.
- At risk: cash due this month that you probably won't see until after the month ends, based on how your debtors usually pay.
- Recover today: long-overdue cash you can hand to the Chaser collections team. You'll see any unpaid invoice 90 or more days past its due date, from debtors whose net balance is in debit. If nothing is that old, you'll see invoices 60 or more days overdue instead. The number of actions depends on how many invoices make up the total. If a debtor has nothing 60 or more days overdue, you won't see this tile.

Your current cash position
Use the second row of tiles to see where your receivables stand right now and when your cash is likely to arrive.
- Cash outstanding: the total your debtors owe you right now across every unpaid invoice, whether it's due later or already overdue. This counts only debtors whose net balance is in debit, which means they owe you money overall.
- Expected: cash you're likely to collect within the next 30 days, based on each debtor's average payment delay. Your DSO sits just beneath this figure for context.
- DSO (days sales outstanding): the average number of days your debtors took to pay you last month, measured across your whole business rather than just your current debtors. The tile names the month it covers and how many invoices it's based on. You'll see last month rather than the current one, because the current month is still provisional and would give you a misleading figure.

Exposure summary
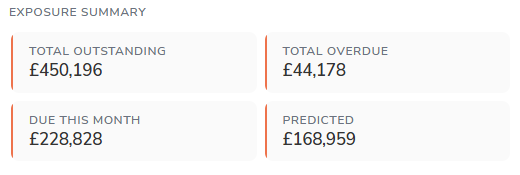
This section breaks your overall exposure into four figures.
- Total outstanding: the same calculation as cash outstanding, shown in your base currency.
- Total overdue: the portion of your outstanding cash that's already past its due date.
- Due this month: unpaid invoices with a due date in the current calendar month.
- Predicted: cash you're on track to collect this month. This takes your invoices due this month or next, adds each debtor's average days to pay to the due date, and counts the ones that land in the current month.
Cash timing bands
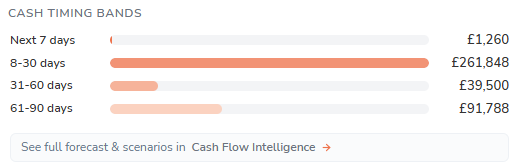
See your outstanding cash grouped into buckets by due date.
- Check the amounts due in the next 7 days, 8–30 days, 31–60 days, and 61–90 days.
- Click any band to see the invoices behind it.
This week
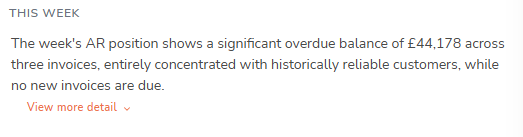
Every Monday, you'll find a short summary of your top risks and priorities for the week ahead.
- Check this section at the start of your week for a quick overview.
- It covers your highest-risk debtors, your largest overdue invoices, and any notable trends.
- It also names debtors who normally pay reliably but haven't paid yet, based on their usual payment behavior. These are often your quickest wins.
Payment friction
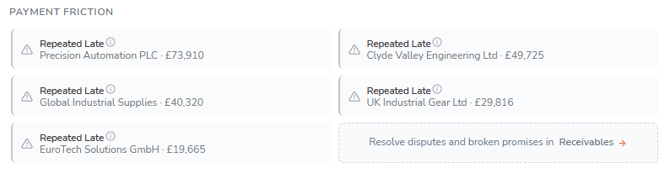
These flags appear when a debtor's payment behavior looks problematic. You'll see up to five at a time, and they refresh as your accounting data syncs. Each flag names the debtor and the amount involved. Point at the information icon for a suggested next step, such as reducing that debtor's credit terms or credit limit.
- Repeated late: a debtor has multiple invoices that were paid more than 4 days past their due date.
- Dispute: an invoice marked as in dispute that's at least 1 week overdue.
- Broken promise: an invoice with a promise-to-pay date that has passed but remains unpaid.
- At risk: if none of the above apply, you'll see your highest-value invoices where the predicted payment date falls up to 4 days after the due date.
Click any flag to open that debtor or invoice. Resolve disputes and broken promises in Receivables opens the same debtor in Receivables.
What can impact your cash
Alongside payment friction, you'll find the trends and individual debtors most likely to affect your position.
- Cash at risk if current trends continue: the total from invoices that aren't due yet, where each debtor's average days to pay would push payment more than 4 days beyond the due date.
- Debtors delaying 45+ days: how many debtors have invoices 45 or more days past their due date, and what that adds up to. Invoices that slip more than a month tend to roll into the next period, which is where they hurt your cash flow most.
- Collections velocity: how your DSO compares with previous months. A falling DSO means you're collecting faster. A rising DSO means you're collecting more slowly.
- Top debtor: the unpaid invoice with the highest disputed value, plus how long ago someone raised the dispute. If no disputes are active, you'll see the debtor with the largest net balance in debit that also has at least one overdue invoice.

What to do next
Use the cards at the bottom of the dashboard to act on what you've just seen.
- Recover cash faster: set up automated chase sequences.
- Improve predictability: review your forecasts and scenarios. Available for Xero and AccountsIQ.
- Unlock working capital: coming soon. Working capital tools aren't available yet.

Important things to know
- How predictions work: your on track, at risk, expected, and predicted figures all add each debtor's average days to pay to their invoice due date. They use your debtors' payment history, not just due dates.
- Who's included: most tiles count only debtors whose net balance is in debit, which means they owe you money overall. DSO is the exception. It covers your whole business for the previous month.
- Cash Flow Intelligence availability: if you use Xero or AccountsIQ, cash timing bands and some forecast links take you to Cash Flow Intelligence. For other integrations, these links go to AR forecasting instead.
- Data sync limits: how much history you get depends on your accounting integration.
- The old receivables dashboard: your existing receivables dashboard stays available in the Receivables menu. The DRM dashboard doesn't replace it.
Related articles
- Getting started using Chaser
- Forecast your receivables (AR forecast)
- Getting started with the cash flow forecast table
Still need help?
Get in touch with the Chaser support team : support@chaserhq.com